Reports
💡
Needs team credentials to use this command.
You can get reports on your team containing:
- number of seats provisioned, used and pending
- current password health score
- aggregated password health score history
Fetch reports
The following commands take in input the number of days to look back for the password health history. The default is 0 day.
dcli t report 30Here is the structure of the report:
| Output Interface | Description | Type |
|---|---|---|
seats.provisioned | The total number of seats that are paid | number |
seats.used | The number of used seats (active, pending) | number |
seats.pending | The number of pending invitations | number |
passwordHealthHistory | Array containing objects with date and securityIndex properties | array |
passwordHealth.securityIndex | The aggregated security index of the team | number |
passwordHealth.passwords | The total number of passwords in this team | number |
passwordHealth.safe | The total number of safe passwords in this team | number |
passwordHealth.weak | The total number of weak passwords in this team | number |
passwordHealth.reused | The total number of reused passwords in this team | number |
passwordHealth.compromised | The total number of compromised passwords in this team | number |
Generate graphics from reports
One way to consume password health history reports is to generate graphics from them.
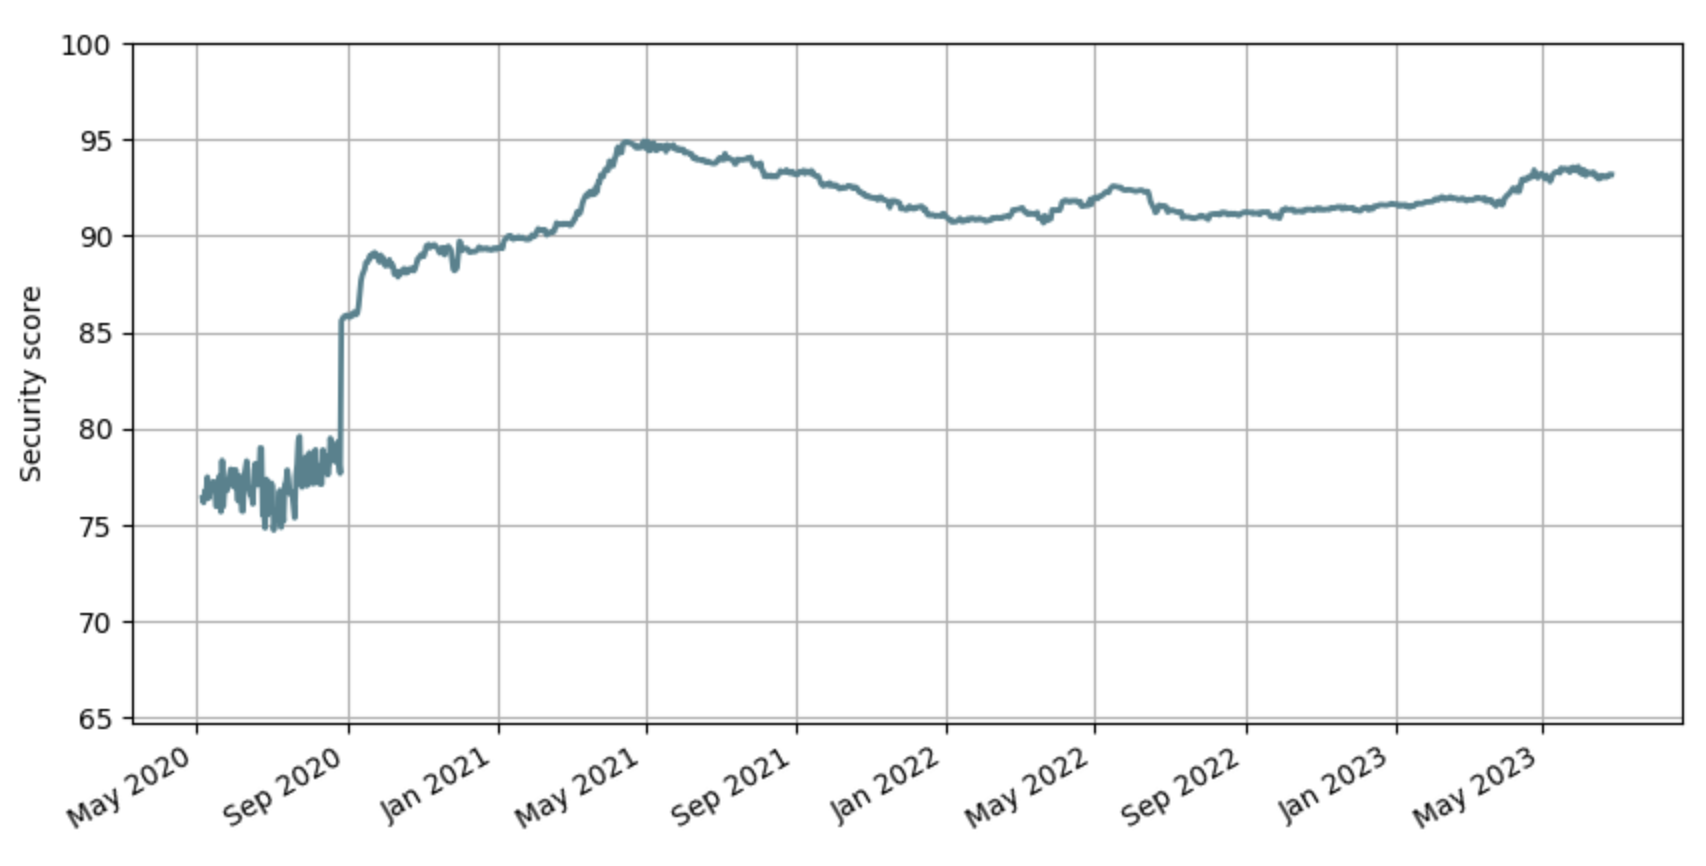
The following Python script example will generate a graphic from the report.
generate-graph.py
import matplotlib.pyplot as plt
import numpy as np


def format_month(month: str):
    match month:
        case "01":
            return "Jan"
        case "02":
            return "Feb"
        case "03":
            return "Mar"
        case "04":
            return "Apr"
        case "05":
            return "May"
        case "06":
            return "Jun"
        case "07":
            return "Jui"
        case "08":
            return "Aug"
        case "09":
            return "Sep"
        case "10":
            return "Oct"
        case "11":
            return "Nov"
        case "12":
            return "Dec"


def format_x_label(label: str):
    year, month = label.split("-")
    return f"{format_month(month)} {year}"


def generate_graph(file_path: str, data):
    dates = []
    values = []
    for value in data:
        dates.append(np.datetime64(value["date"]))
        values.append(value["securityIndex"])

    # create two subplots with the shared x and y axes
    fig, (ax) = plt.subplots(figsize=(10, 5))

    ax.plot(dates, values, lw=2, color="#4e828f")
    ax.grid(True)

    ax.set_ylabel("Security score")
    labels = ax.get_xticklabels()
    for label in labels:
        label._text = format_x_label(label._text)
    ax.set_xticklabels(labels)

    ax.set_ylim(min(values) - 10, 100)

    fig.suptitle("Evolution of the team security score")
    fig.autofmt_xdate()

    plt.savefig(file_path)
    plt.close()
    return file_path